Keywords searching tool To be successful in search engine optimization or SEO, you need to know the long tail keywords. Long-tail keywords get less traffic than generic terms. However, more intentional users and more qualified traffic follow. In order to increase the probability of your website or blog being searched on the Internet, you should use keywords that are suitable for search and have a high search probability. Below are effective free representative keyword research tools that can quickly and easily identify powerful long-tail keywords for search engine optimization. Google Trends Google Trends is a free keyword related tool for search engines provided by Google. You can enter multiple keywords and filter by location, search history and category. As you enter information, it shows the web's interest in a particular keyword, the cause of that interest, and where the traffic is coming from. 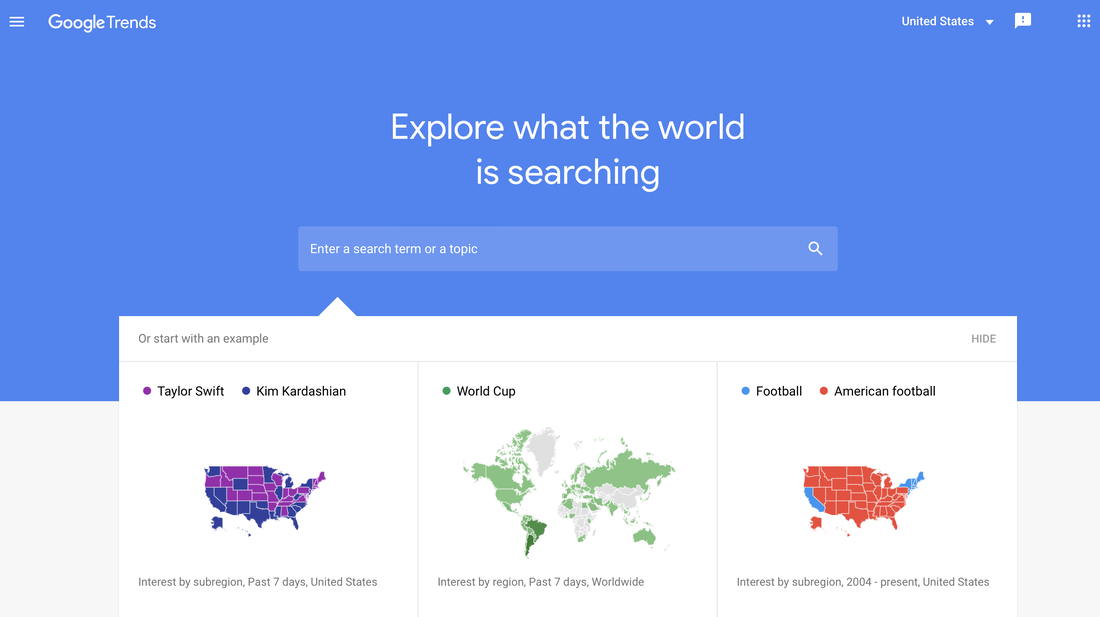 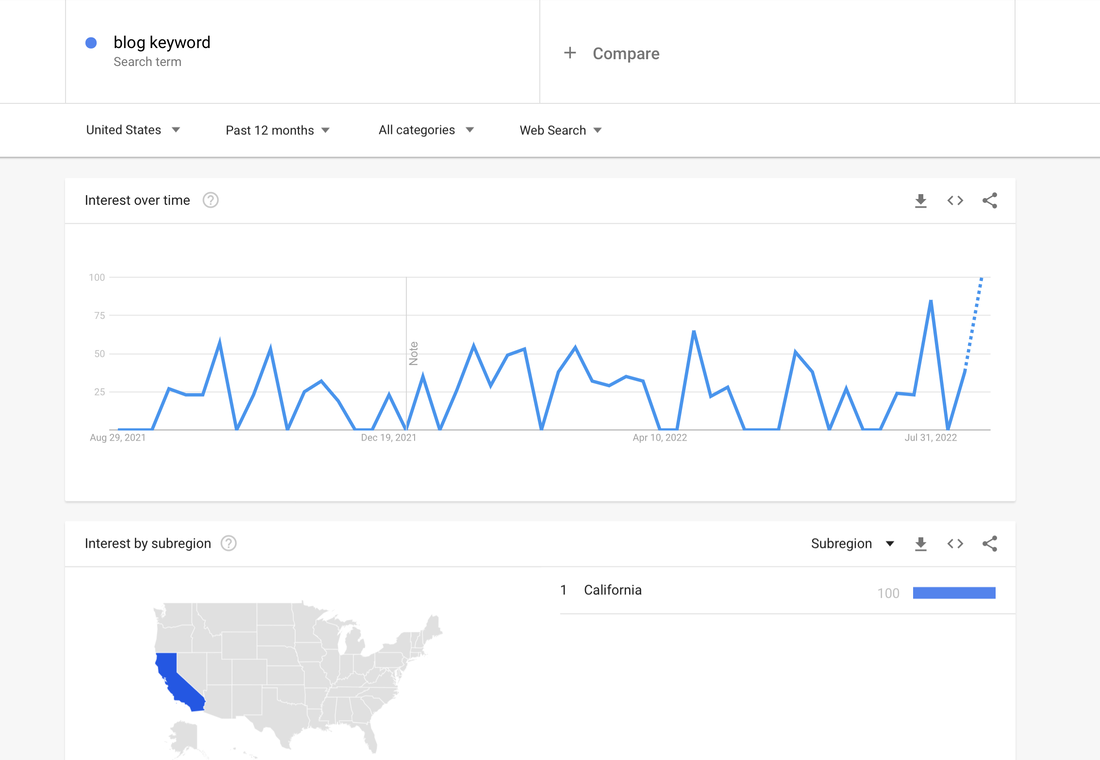 The biggest advantage of Google Trends is that unlike most keyword research tools, it does not provide only static numbers. Instead, it creates colorful, interactive graphs that you can apply with, download, and share on your website. It also provides dynamic insights into keywords by suggesting the relative popularity of search terms over time. 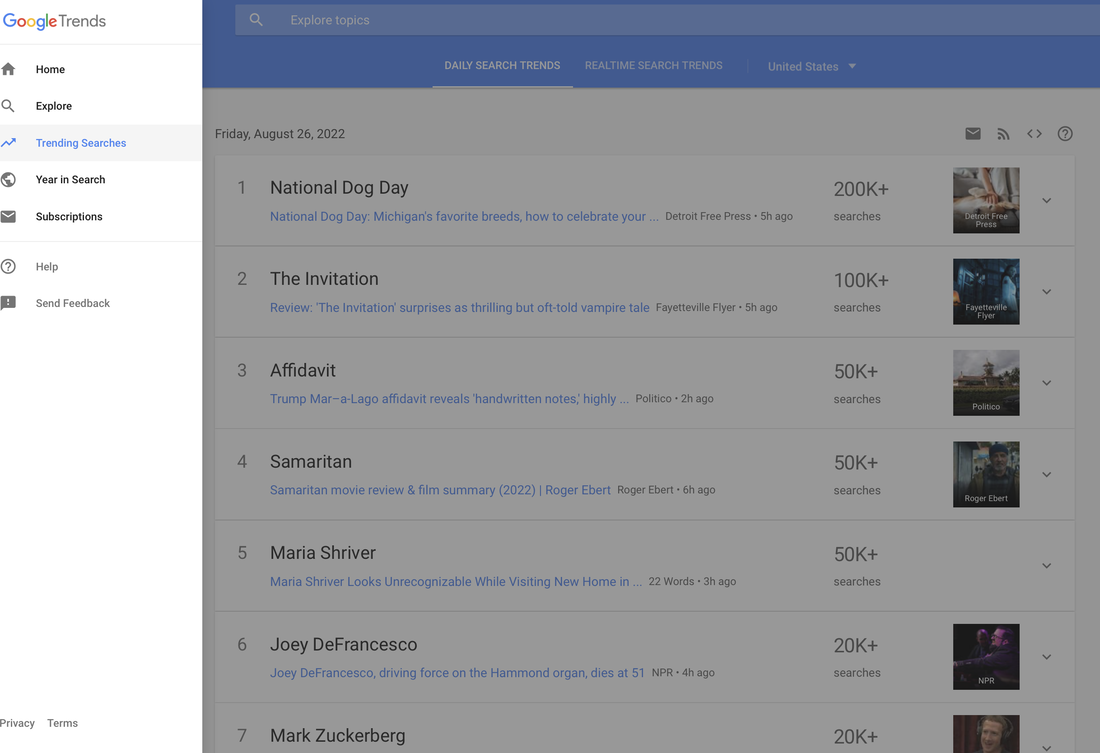 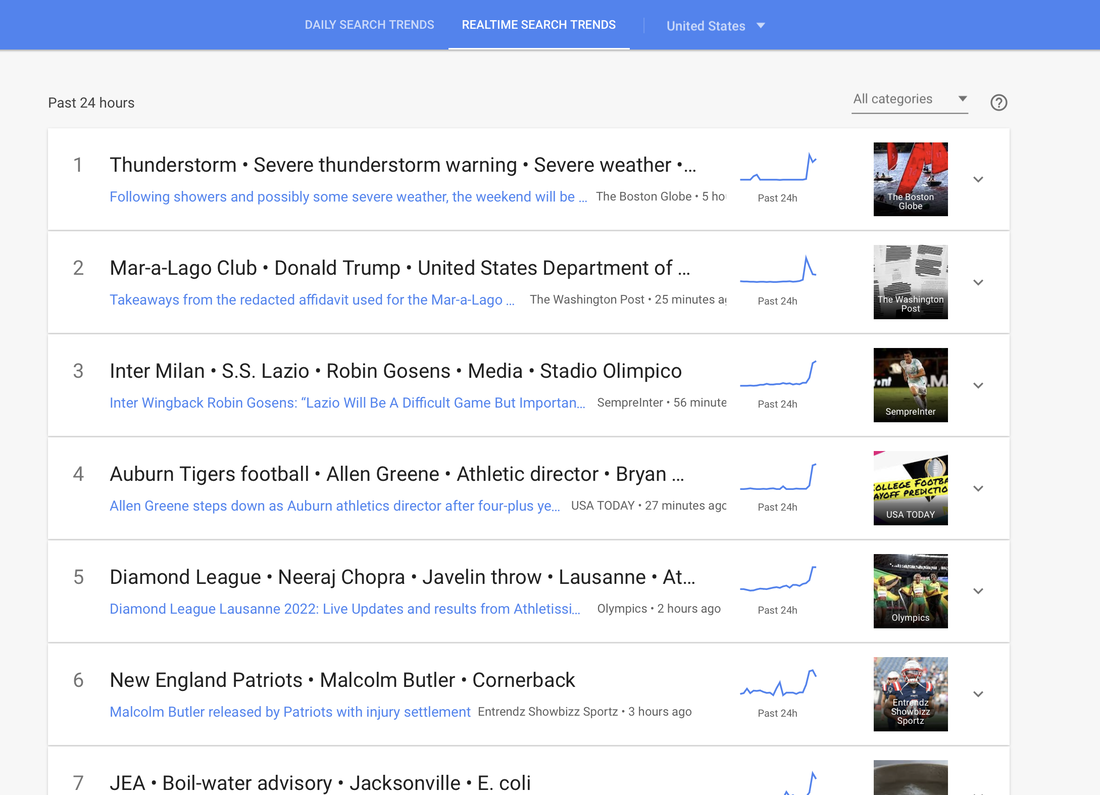 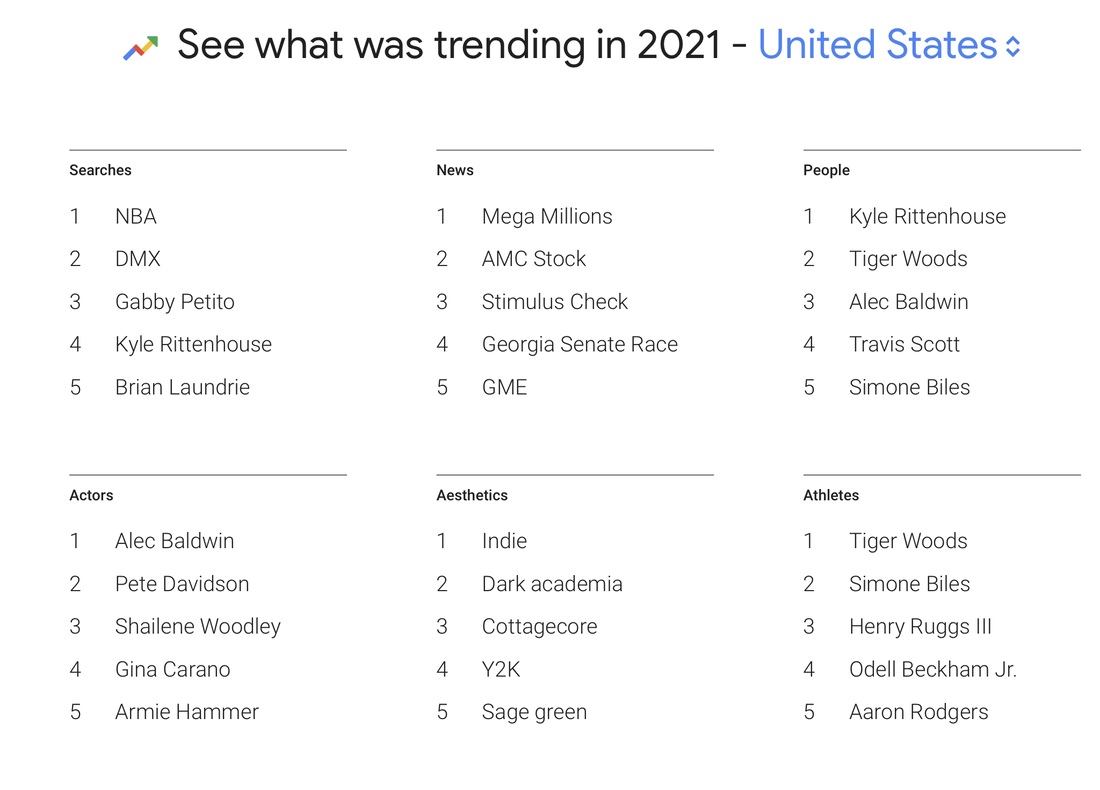 Also, as shown above, you can look at keywords that have become trending by country, month, and year. Of course, it is also possible to view real-time keywords. Keyword Tool.io Keyword tool io is a very basic level keyword research tool. However, it is a very useful tool if you have long-tail keywords in mind and you only want to check the risks of related keywords. You need to create an account to create the tool, but if you don't want to use the advanced features and just want to check the list, you can use it for free. If you want to use the pro version, that is, pay a certain fee, you can extract keywords, create content, and receive analysis results that can be used for search engine optimization and other marketing. 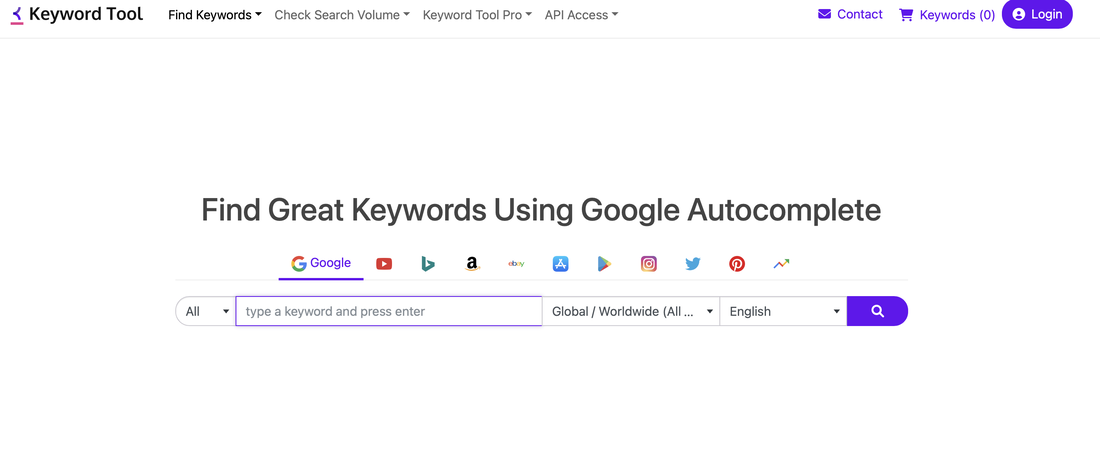 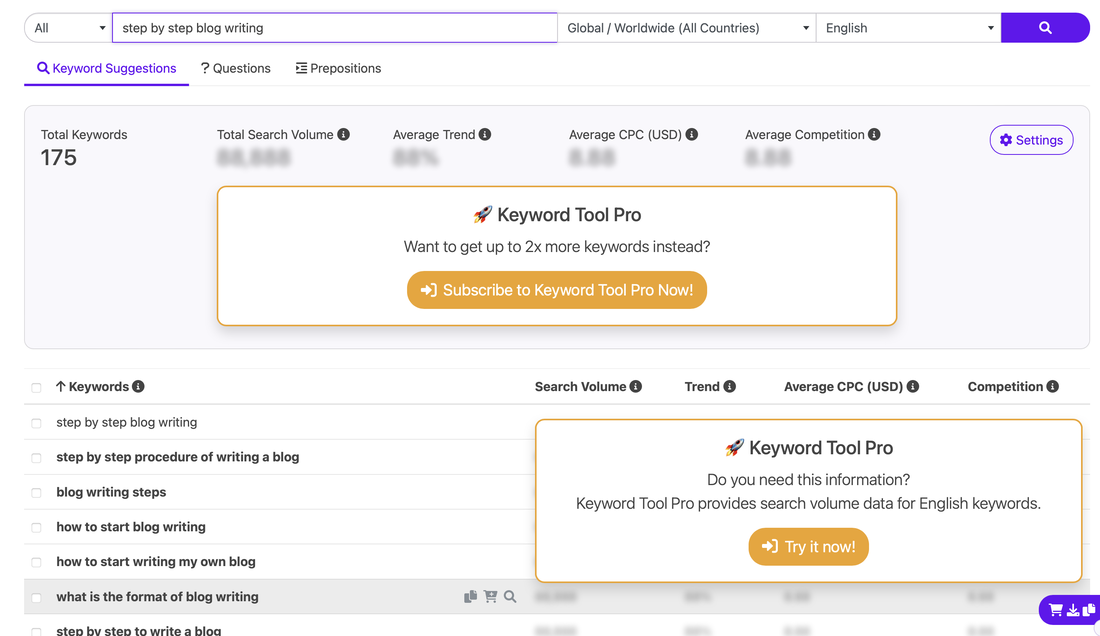 Term Explorer Term Explorer is a tool that provides research reports among the currently available keyword search tools. You can get over 10,000 derived keywords from one keyword. It also provides a variety of indicators to help keep your results as relevant and relevant as possible. If you plan to use the keyword tool only a few times a day, try the free version first. 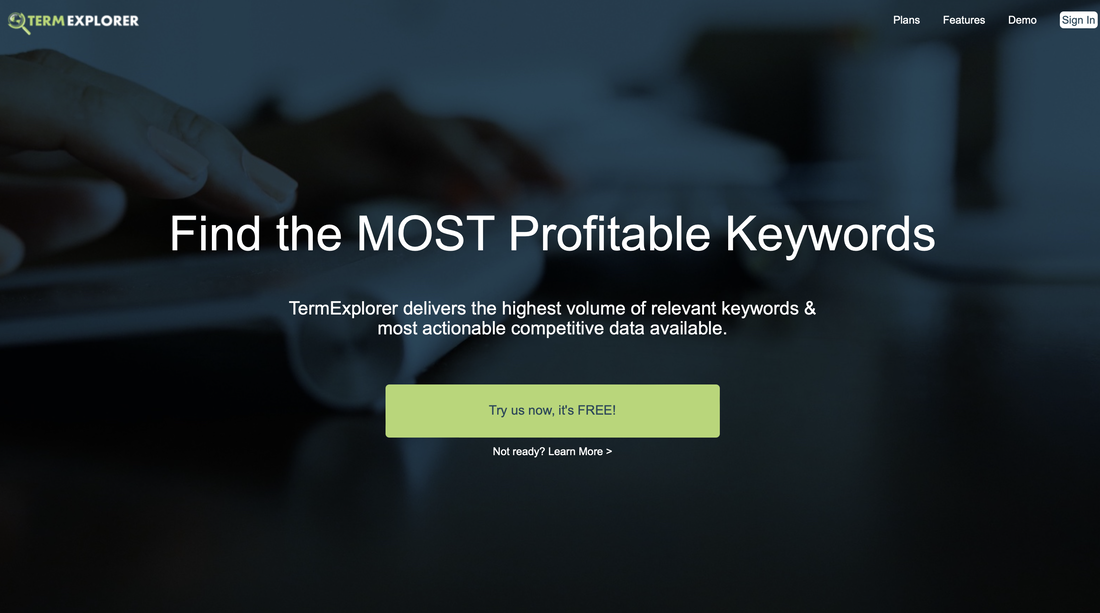
0 Comments
R-Programming & R studio It may surprise you that computer programming is suddenly appearing on the artist's blog, but in fact, this is the foundation work before I visualize financial analytic data. Now I am currently starting to work as an intern at Girin Instruments company. My role is to imagine the statistically analyzed data. For this reason, I am studying programming called R-Programming. Below are the basics of the related programming. In the future, this content will be regularly organized into a category called Art & Data analysis. The R program is a programming language for statistical analysis and graphics developed in 1993 at the University of Auckland, New Zealand. It is an essential analysis tool in data science and data analysis. It can be operated on various operating systems such as Windows, Unix, and macOS, and since it is open-source, anyone can use it for free. Above all, it is a programming language, but it is interactive, and there are various graphic sources linked to basic statistical calculations. Users can create their program packages and share them freely for free. (https://shiny.rstudio.com/gallery/) Below is a chart comparing it to other statistical program packages from Stony Brook University Dr. Hyang-Joo Kim's lecture notes. 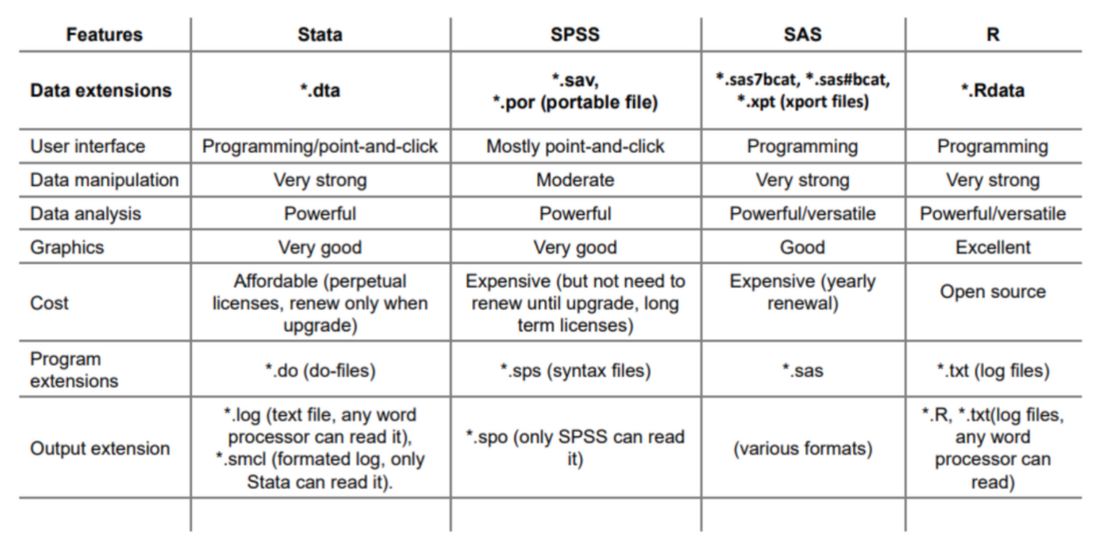 Because I am working on a picture, I like that the graphic function is excellent. With the advancement of IT technology, there is an increasing need to analyze and organize data that has grown exponentially to the extent that traditional data processing methods cannot handle it. In addition, if these data analysis techniques are to be transmitted to the general public, they must be well visualized. R program is the best alternative to solve the needs of the times. Below is a site where you can download an R program package that anyone can use for free. Click on the red rectangular area in the lower-left menu bar. 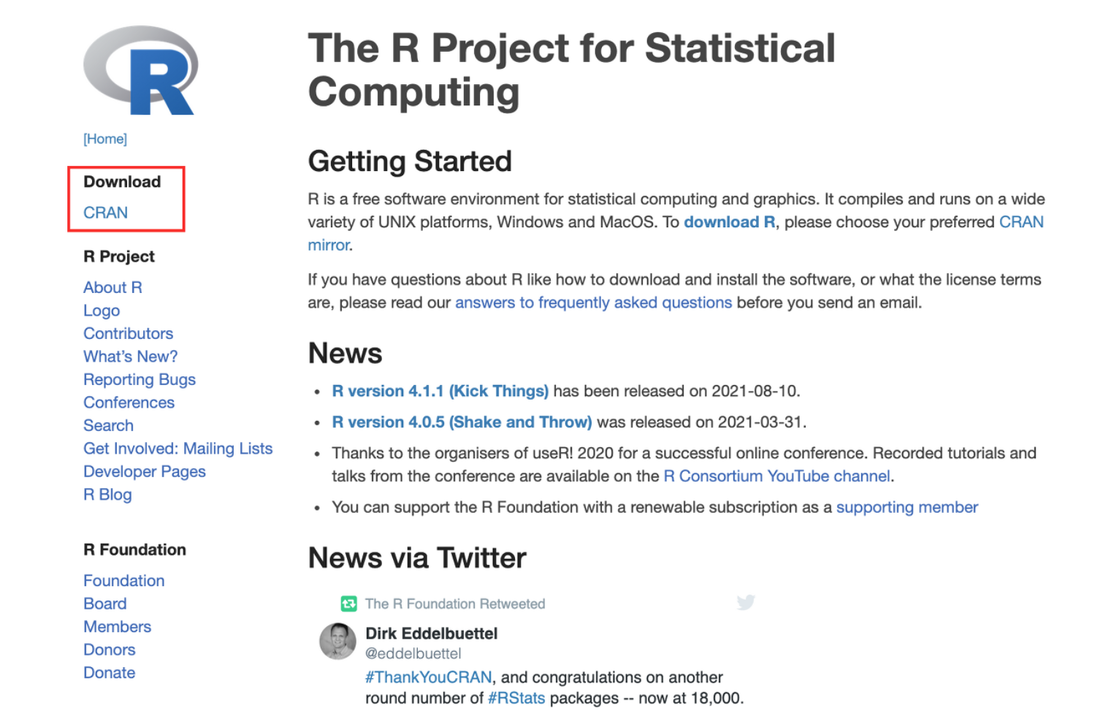 Below is a link to download the R program package set for the operating system. Click on the red area below. 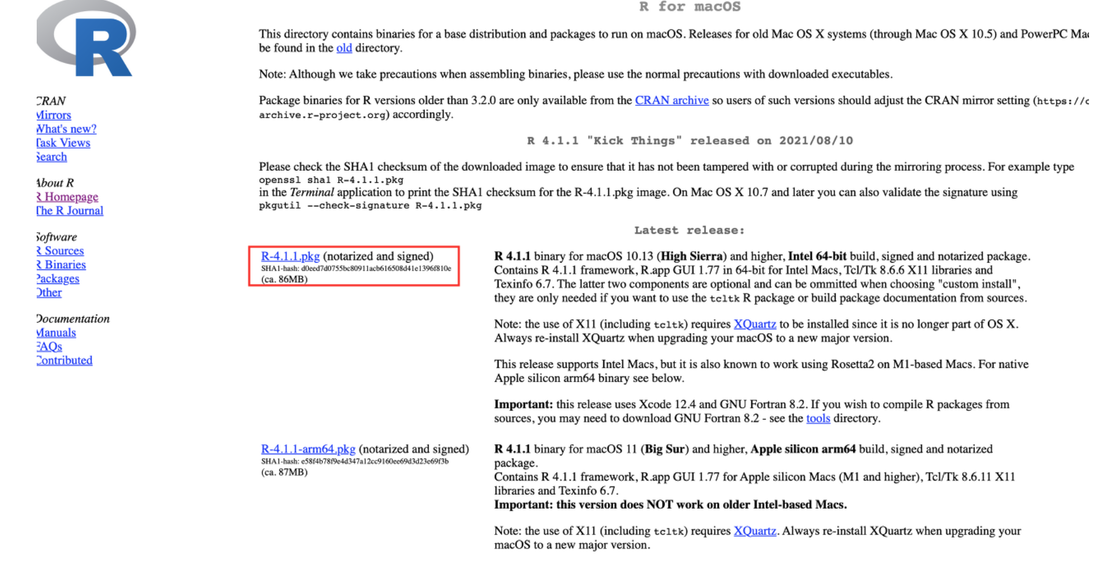 This will open the installation window where you can install the program as shown below. Click to install. 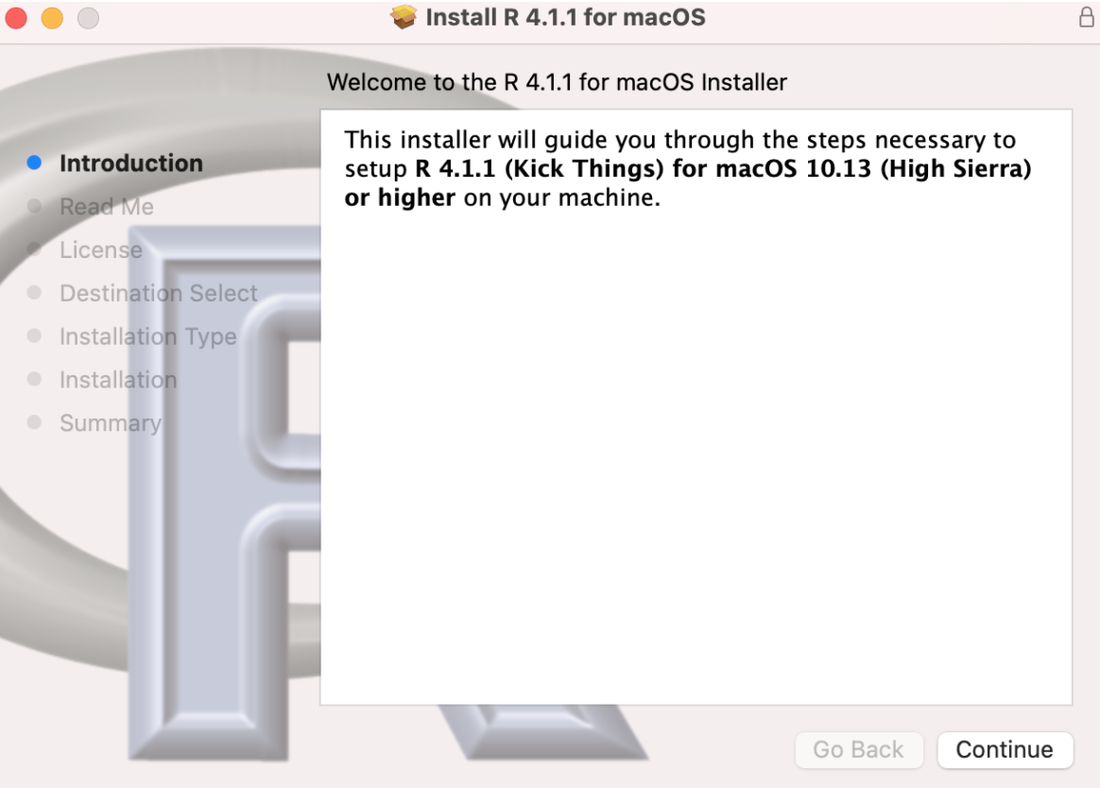 Below are the icons that appear on the screen and what they look like when you click them.  It is R Studio that provides an IDE (Integrated Development Environment) that makes R programming easier and more efficient. Below is a site where you can download R Studio. 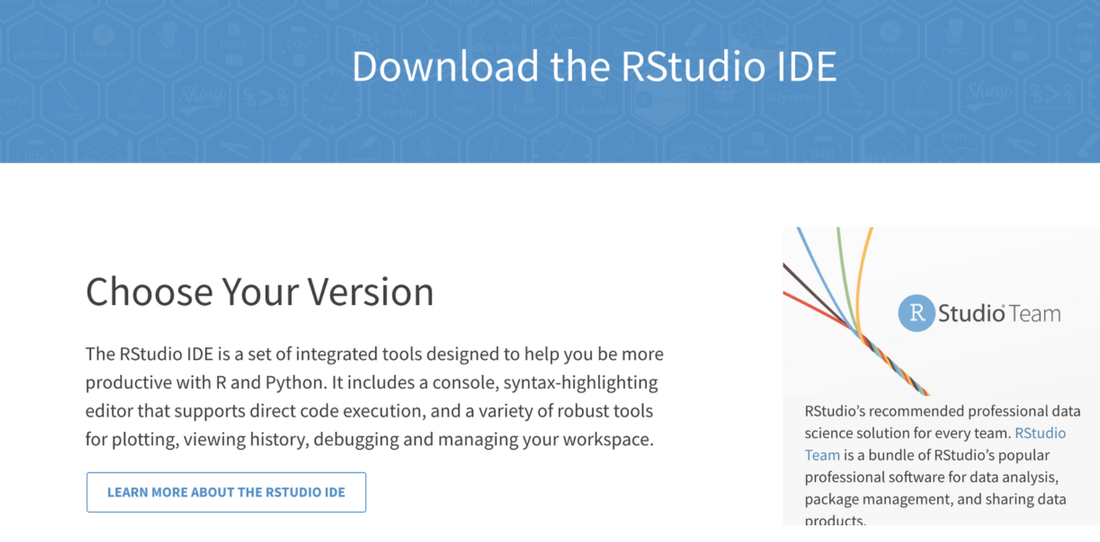 If you scroll down the homepage, you will see a free download button as shown below. Click this button. 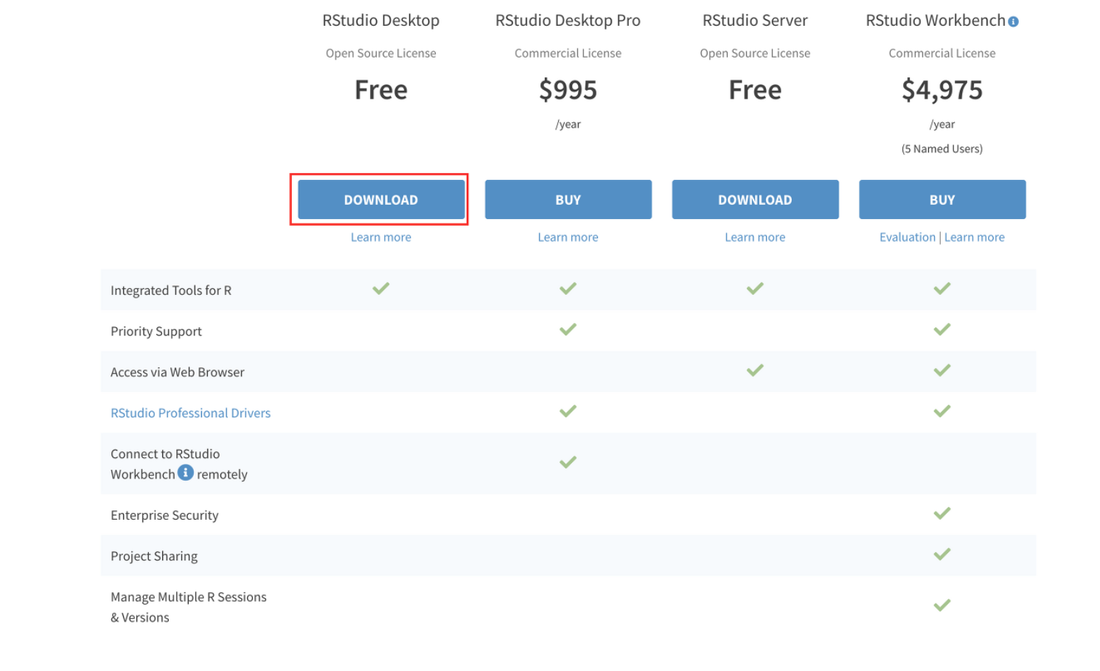 When you click the download button, the following screen appears. Install the program package for your operating system. 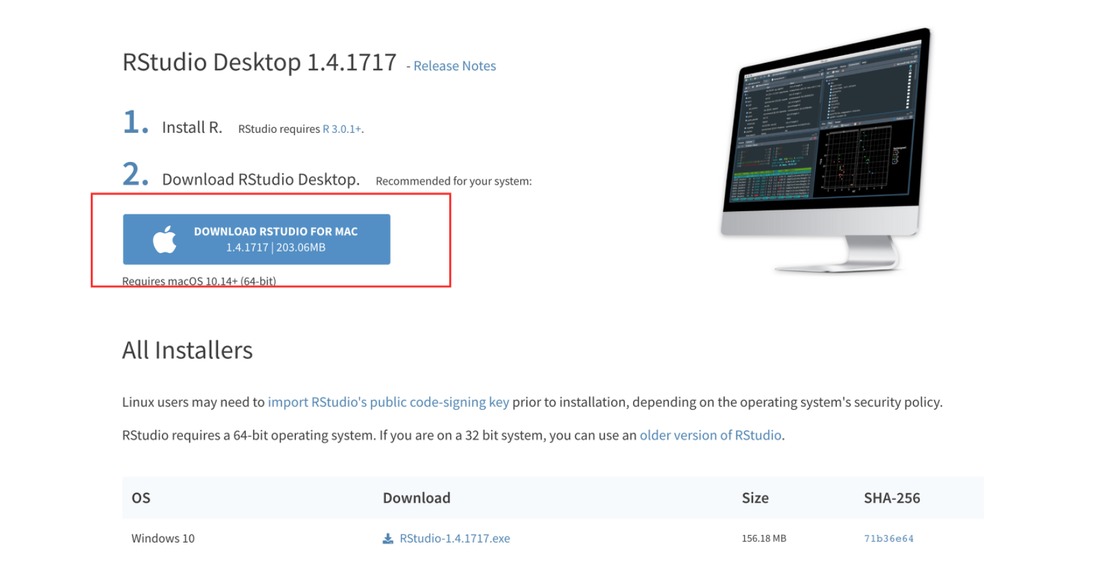 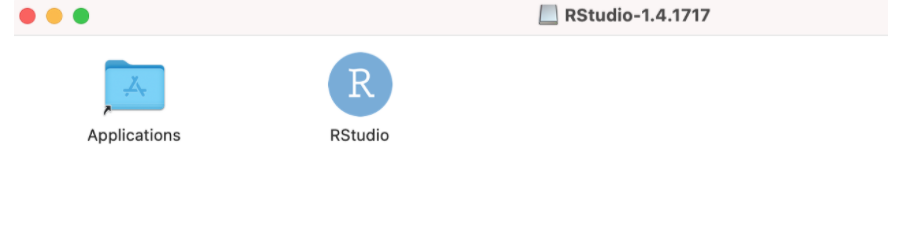 When you run RStudio, you will see the program editing window as shown below. 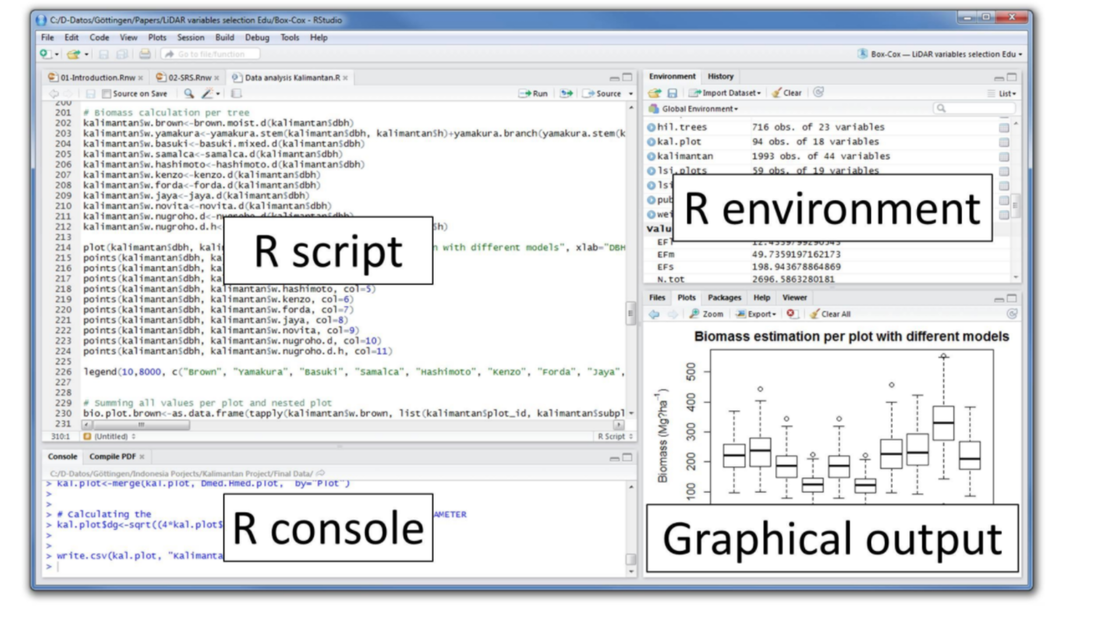 The above area performs the following functions: R script: A file (extension: .R) in which an R program is saved can be created, loaded, and edited, and a statement can be directly executed. Move the cursor to the statement to be executed and press ctrl-enter to display the result on the console screen. R console: You can enter R commands directly in the interactive mode. The dialog box has a > mark, which is called a prompt, and provides an environment where you can enter a command and get the result immediately by hitting enter. R environment : Shows the status of objects created while executing R commands, and also shows the history of past commands. Graphical output: The result of the picture is printed and displayed, the package is installed, and the status is shown. Also, help for R language and packages is provided. |
Myungja Anna KohArtist Categories
All
Archives
July 2024
|

|
Tutorial |
 RSS Feed