Art in financial field
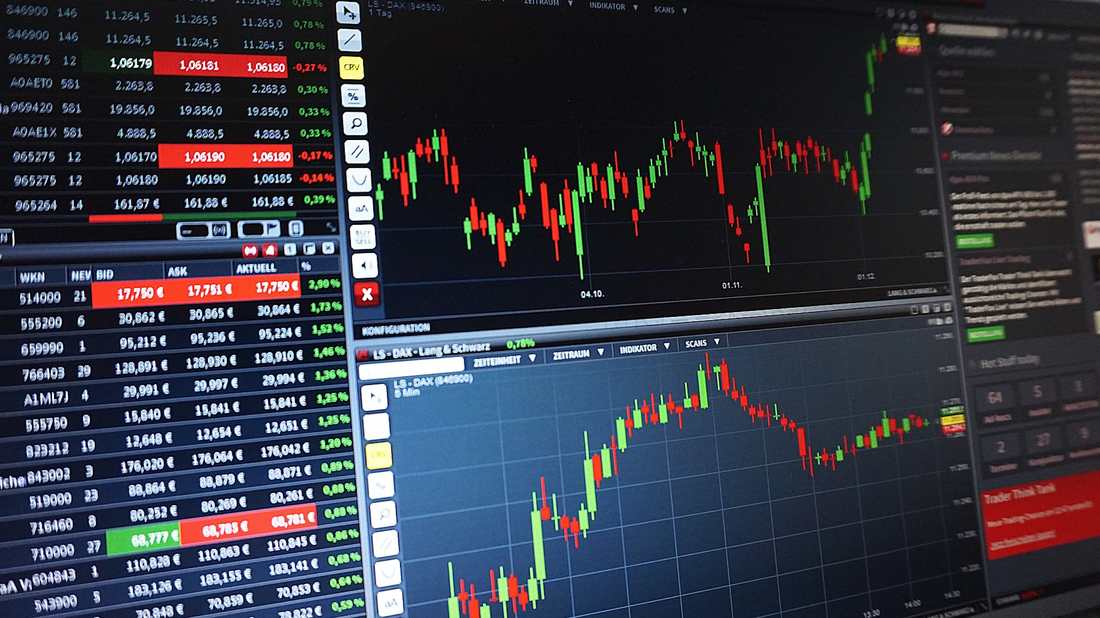
Every object in the world has its color. As discussed in the previous post, even in colorless and odorless data, a color symbolizes the data. So is the financial market. Just as we stop at a red light at a traffic light and cross over to a green one, color in the stock market is a kind of rule and helps us understand the meaning of data at a glance. When investors check their stock status, the first thing they do is check whether it is red or green, and then cry and laugh.
While working on a design to visualize financial market data, I recently had an opportunity to compare US charts with Korean charts. Interestingly, each culture and location is different, so the color symbolized is also different. The colors of the US and South Korean stock markets are opposite. First, in the Korean stock market, red is the color for rising stock prices and blue is for falling stocks, but the opposite is true for US stocks. An uptrend is green and a fall is red.
In western countries, it is said that blue or green has had a good meaning for a long time. However, in the East, for example, in China and Japan, red was preferred because it symbolizes a powerful and dynamic figure such as passion, challenge, and good fortune.
Since Korea is also a country in the East, the stock price is rising in red. Red color tends to excite and tense people, so it is more suitable to indicate an upward index. At the same time, blue means to watch the market calmly and rationally and was applied to consider the psychological action of showing a low index. For example, in Korea, when a lot of red appears on the stock situation monitor, it is said that the stock market is colored with autumn leaves. However, in Western countries, including the United States, it is a bloody day.
1 Comment
|
Myungja Anna KohArtist Categories
All
Archives
July 2024
|
Proudly powered by Weebly


 RSS Feed